 ar
ar bg
bg hr
hr cs
cs da
da nl
nl fi
fi fr
fr de
de el
el hi
hi it
it ko
ko no
no pl
pl pt
pt ro
ro ru
ru es
es sv
sv tl
tl iw
iw id
id lv
lv lt
lt sr
sr sk
sk sl
sl uk
uk vi
vi et
et hu
hu th
th tr
tr fa
fa ms
ms hy
hy ka
ka ur
ur bn
bn mn
mn ta
ta kk
kk uz
uz ku
ku
Guidewheel Measuring Rod
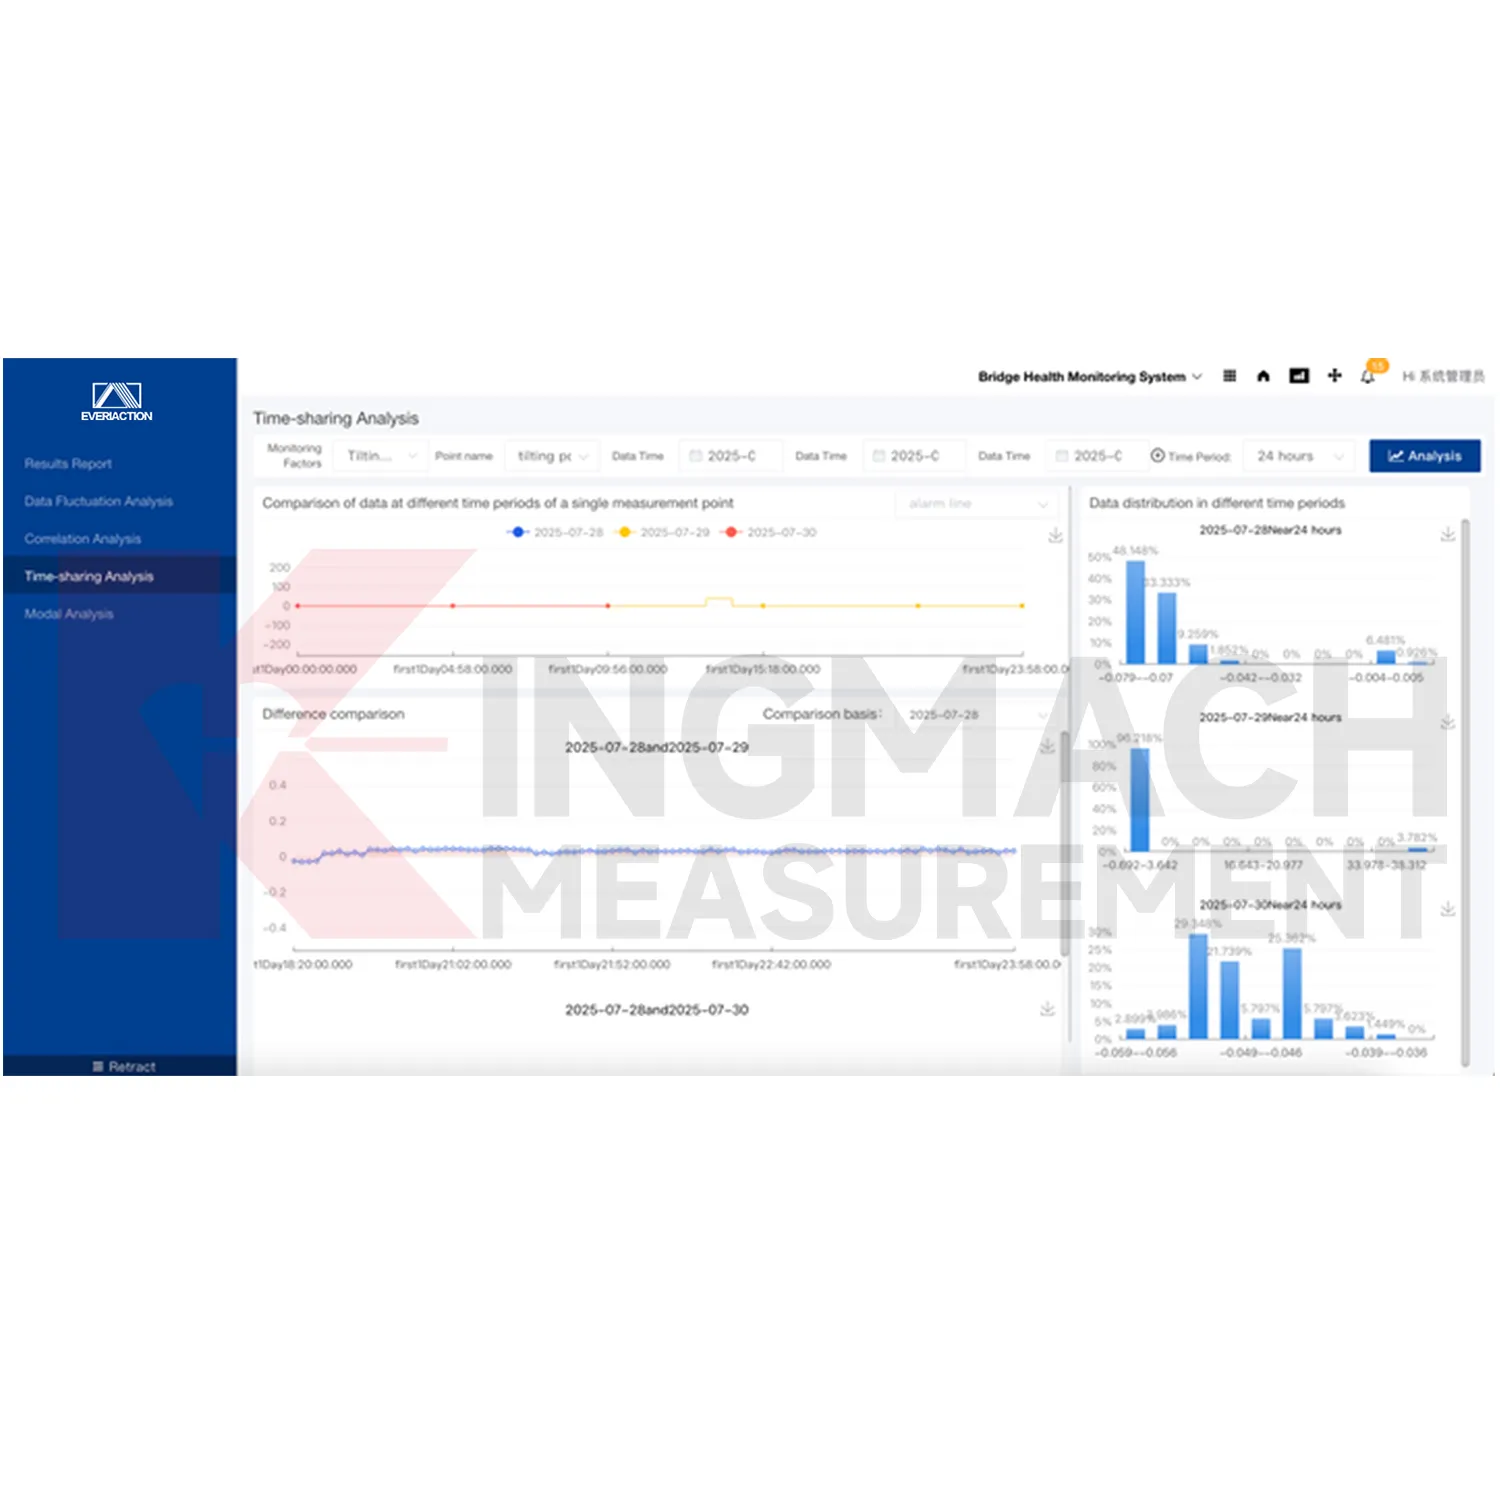
Kingmach Guidewheel Measuring Rod includes functions for fast storage, real-time filtering, efficient analysis, complex statistics, user-friendly display, and personalized customization of collected data. These functions help the user move from channel values to engineering understanding. Trend curves can show whether a point is stable, rising, falling, or reacting to weather and construction events. Filtering can reduce distractions before review. Custom display layouts help different users see the data they need for daily operation, risk review, or management reporting.
Application of Guidewheel Measuring Rod
Wind tower monitoring uses Kingmach Guidewheel Measuring Rod to combine tower tilt, vibration, foundation behavior, strain, wind, temperature, and maintenance records. A tower may respond differently under high wind, temperature change, operation state, and foundation conditions. The platform can visualize trends and preserve event history so reviewers can compare repeated behavior under similar conditions. Alarm configuration helps identify readings that need field inspection without treating every normal operating fluctuation as a fault.
The future of Guidewheel Measuring Rod
IoT development will make Kingmach Guidewheel Measuring Rod more important because field devices will keep expanding in number and variety. A bridge, tunnel, dam, or slope may use wired channels, wireless nodes, edge loggers, weather stations, and third-party devices at the same time. The platform's compatibility with different manufacturers, types, and models supports this mixed-device future. As monitoring networks grow denser, device access, channel naming, alarm rules, and project organization will matter as much as the individual sensor.
Care & Maintenance of Guidewheel Measuring Rod
Before deploying Kingmach Guidewheel Measuring Rod, define the project structure, asset names, monitoring points, device types, channel names, alarm levels, user roles, and report needs. A platform is easier to use when the data model matches the actual project. If point names, units, locations, and device IDs are unclear at the start, later trend review and alarm handling become harder. Good setup work creates a stable base for real-time storage, visualization, and long-term project management.
Kingmach Guidewheel Measuring Rod
Kingmach Guidewheel Measuring Rod helps users move from raw readings to risk awareness. The platform can build structural safety models, use formulas, algorithms, and manual engineering review to determine the location and extent of structural damage, and warn of changes in structural performance. This does not replace field inspection; it makes inspection better targeted. When a bridge cable, tunnel lining, slope, dam gallery, or building foundation shows a changing pattern, the data view can point reviewers toward the affected area, related sensors, and alarm record. That gives site teams a clearer starting point for follow-up.
FAQ
Q: What certification is listed?
A: The product information lists GB50982-2014 certification.
Q: What is the minimum order quantity?
A: The local product page lists one piece as the minimum order quantity.
Q: What is the delivery time?
A: Delivery time is listed as instant for the software platform.
Q: How is pricing handled?
A: Pricing is listed as negotiable, so project scope, configuration, and integration needs should be confirmed with Kingmach.
Q: What payment term is shown?
A: The local product page lists T/T in advance.
Reviews
Andrew Lee
The visualization software is intuitive and powerful. It helps us analyze monitoring data efficiently.
James Thompson
The tiltmeters and accelerometers are very sensitive and provide precise data. Perfect for our structural health monitoring system.
Latest Inquiries
To protect the privacy of our buyers, only public service email domains like Gmail, Yahoo, and MSN will be displayed. Additionally, only a limited portion of the inquiry content will be shown.
Ava***@gmail.comAustralia
Hi, I am looking for reliable tiltmeters and accelerometers for structural health monitoring. Please...
Isabella***@gmail.comGermany
Hello, we are evaluating weir flow meters for a water management project. Please share accuracy deta...
Related product categories
- Structural Health Monitoring Sensors
- Web-based Monitoring Software
- Software Platform
- Data management software
- Monitoring Software Suite
- Monitoring system software platform
- Environmental Monitoring
- Visualization Software
- GPS Displacement Monitoring System
- Integrated Monitoring Station
- Settlement Monitoring Rod
- Structural Health Monitoring (SHM) System