 ar
ar bg
bg hr
hr cs
cs da
da nl
nl fi
fi fr
fr de
de el
el hi
hi it
it ko
ko no
no pl
pl pt
pt ro
ro ru
ru es
es sv
sv tl
tl iw
iw id
id lv
lv lt
lt sr
sr sk
sk sl
sl uk
uk vi
vi et
et hu
hu th
th tr
tr fa
fa ms
ms hy
hy ka
ka ur
ur bn
bn mn
mn ta
ta kk
kk uz
uz ku
ku
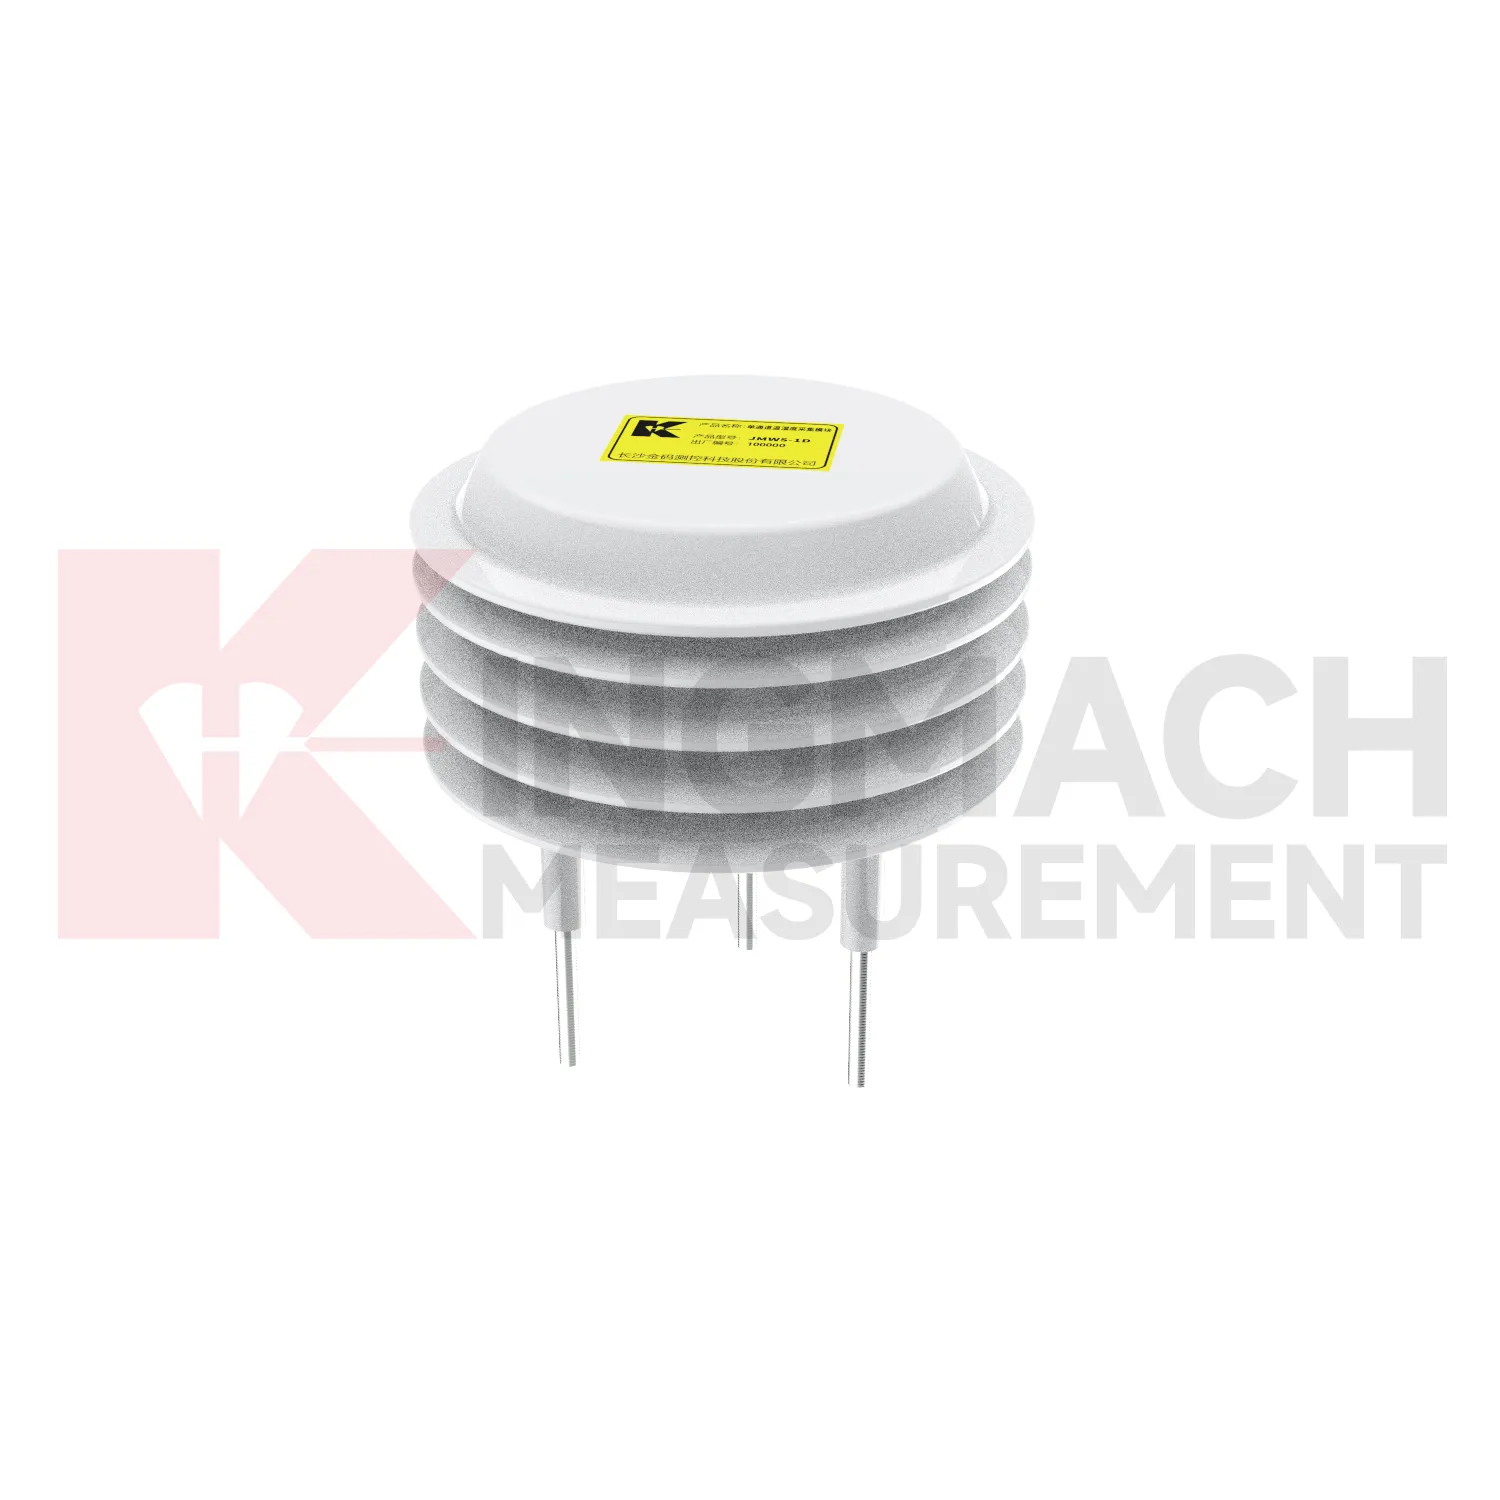
Temperature Sensor
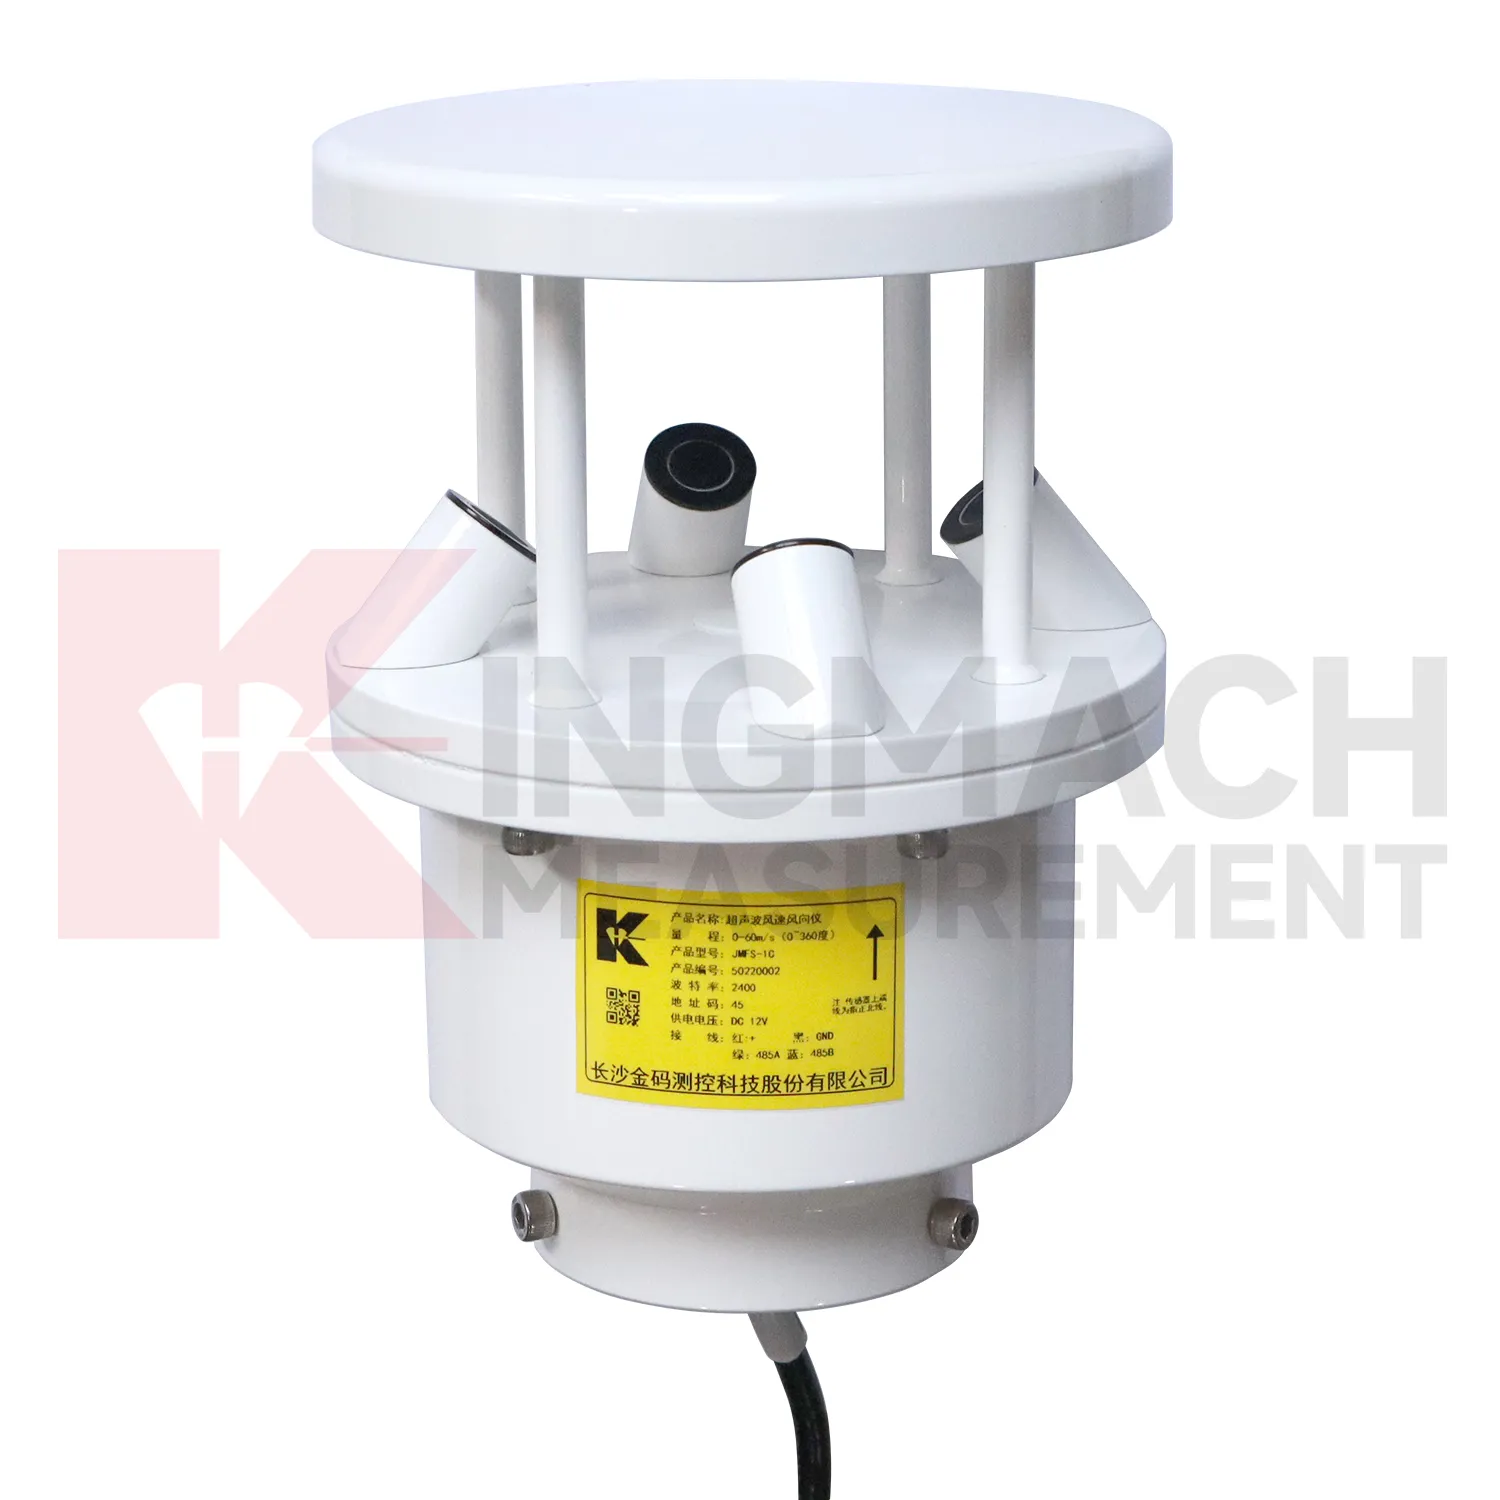
Wind monitoring in Kingmach Temperature Sensor helps explain dynamic response and site exposure on bridges, towers, airports, marine facilities, tunnel portals, urban stations, and wind-sensitive construction areas. Wind values are most useful when the station placement represents the asset being reviewed. A sensor behind a wall or below a sheltered deck may produce neat data but fail to explain the structure. Engineers often need to know direction as well as speed because crosswind, headwind, gusts, and local shielding create different responses. Wind records should be reviewed with vibration, tilt, strain, displacement, pressure, access restrictions, and inspection timing. In exposed environments, maintenance teams also need to understand whether ice, salt, dust, or lightning may have affected the station. The environmental record becomes stronger when it shows both the weather condition and the reliability of the measurement point.
The environmental point should be part of a named monitoring question. It may explain wetting, drying, wind exposure, thermal movement, cabinet stress, or pressure variation, but that purpose needs to be visible in drawings and reports.
If the reading seems unusual, the team should check the physical condition of the station before drawing conclusions about the asset. Blockage, poor exposure, loose wiring, water entry, and changed surroundings can all create misleading patterns.
A practical report links the condition value with time, place, and action. It should help a reviewer decide whether to keep observing, inspect the field point, compare nearby instruments, or record the event as normal site behavior.
Application of Temperature Sensor
Construction sites use Kingmach Temperature Sensor to document conditions that affect work, monitoring data, and later dispute review. Rain can change excavation safety, slope behavior, access roads, concrete work, and water management. Wind can affect lifting, temporary structures, and exposed frames. Temperature and humidity can affect curing, equipment rooms, and sensor cabinets. Environmental data should be collected where it represents the active work zone and should be reviewed beside displacement, settlement, vibration, crack, and inspection records. If a movement change occurs after a storm or heavy wind event, the environmental timeline helps engineers explain the timing. It also gives contractors and owners a shared record instead of relying on memory or informal weather notes.
A practical report links the condition value with time, place, and action. It should help a reviewer decide whether to keep observing, inspect the field point, compare nearby instruments, or record the event as normal site behavior.
For owners, the strongest record is the one that remains understandable after staff changes. Clear units, plain point names, installation photos, maintenance notes, and linked structural channels make the data usable beyond the original project team.
For field teams, this point is most useful when the record shows the condition before the structural response, during the response, and after the site returns to routine operation. The note should include weather timing, inspection access, nearby construction, and whether the linked structural points changed in the same period.
The future of Temperature Sensor
Maintenance analytics will shape future Kingmach Temperature Sensor. A rain point can clog, a soil point can lose contact, a wind point can become sheltered by new equipment, and a humidity point can be affected by cabinet changes. Future platforms can flag flatlines, impossible jumps, missing intervals, and disagreement between related channels. These checks will not replace field inspection, but they will tell teams where to look first. This is especially useful on large projects with many stations. Data quality alerts help prevent months of unreliable environmental records from being accepted as real site behavior.
The maintenance view should be different from the engineering alarm view. It should show station health, last inspection, cleaning history, power condition, enclosure status, and whether nearby site changes may have altered exposure. That helps field crews prioritize practical work before data quality falls.
Over time, maintenance analytics can reveal weak points in the monitoring network itself. If one station repeatedly needs cleaning, loses communication, or disagrees with nearby conditions, the owner can decide whether to improve access, change protection, or move the point to a better location.
Care & Maintenance of Temperature Sensor
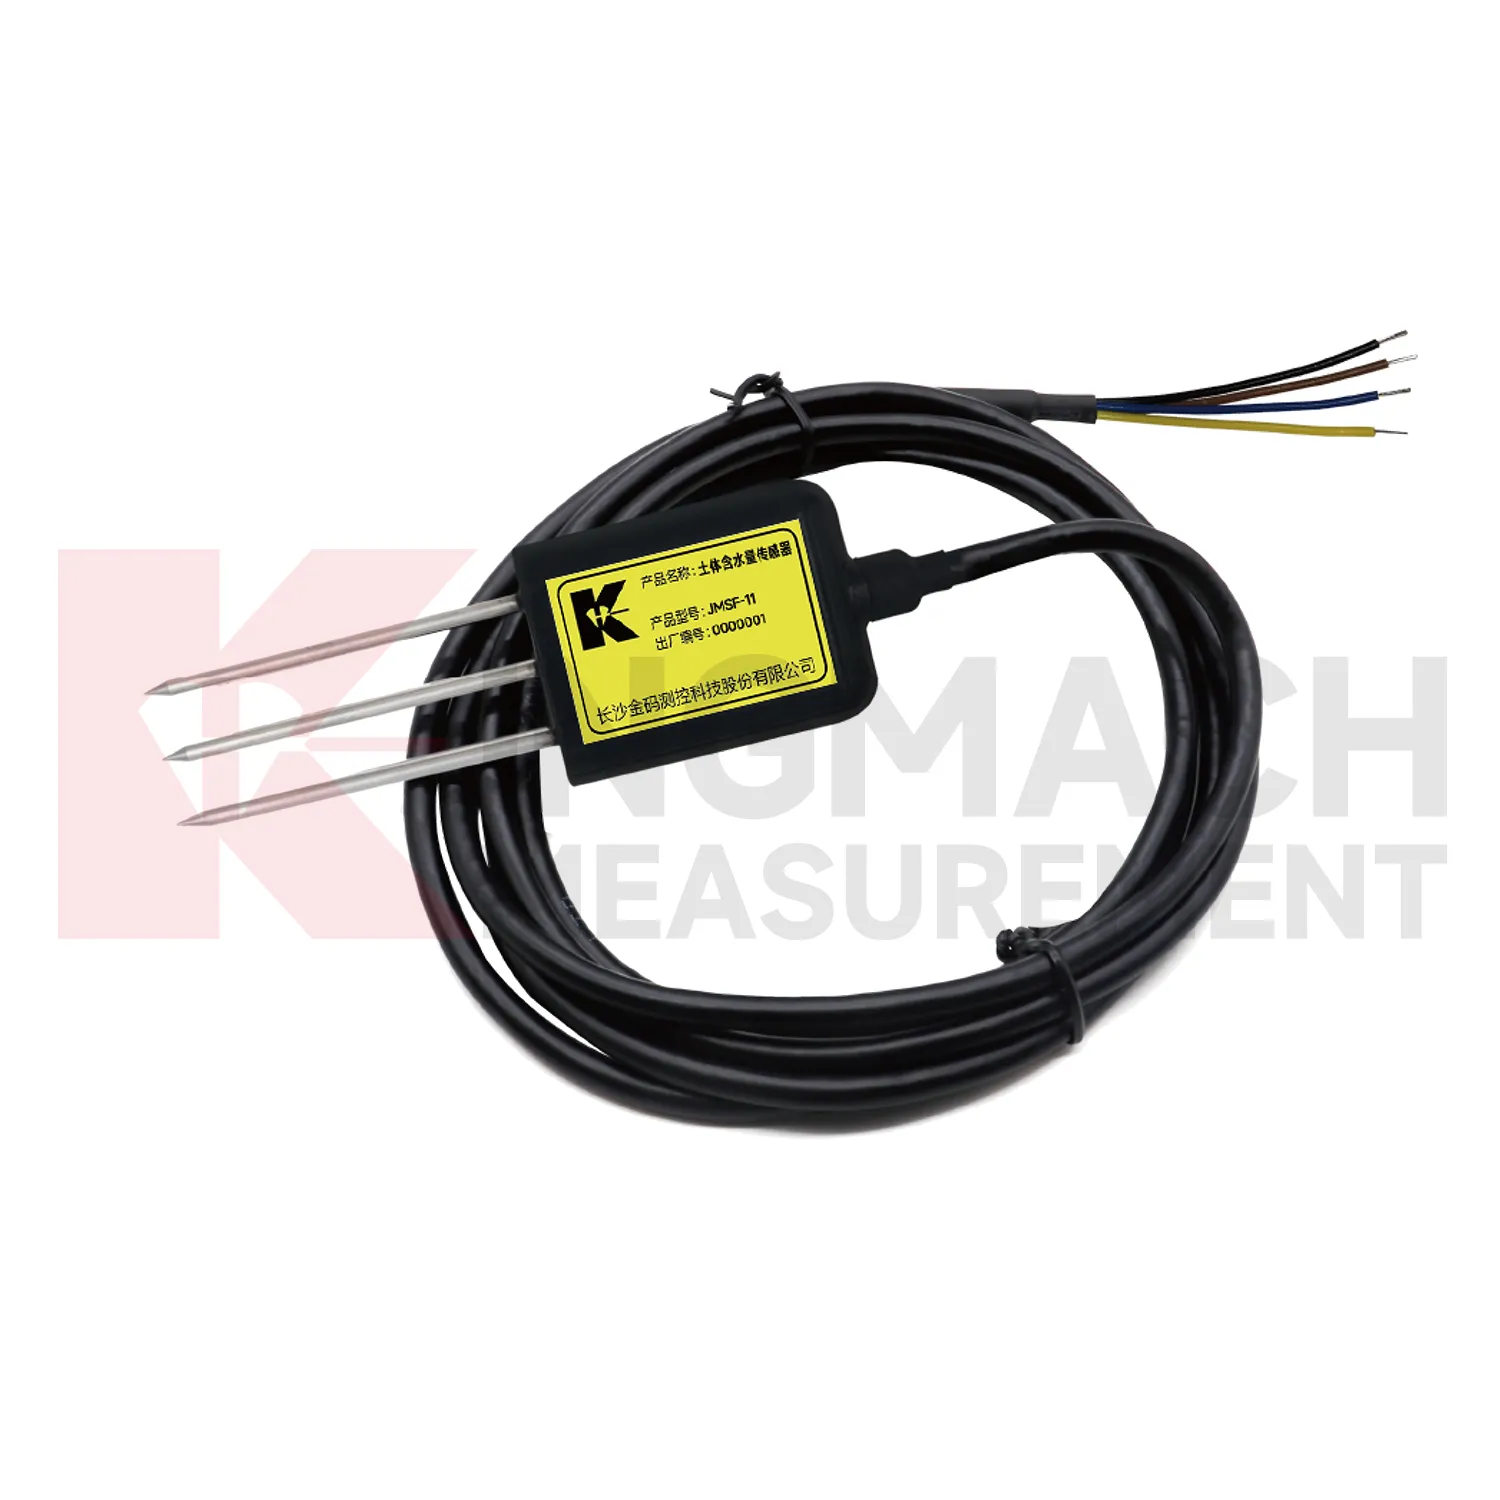
Soil-condition maintenance for Kingmach Temperature Sensor should protect the contact between the buried point and the surrounding material. Air gaps, disturbed soil, cable damage, excavation, animal activity, or water paths along the cable can all affect readings. Installation records should include depth, soil type, location photo, cable route, and first stable value. During review, compare soil wetness with rainfall, irrigation, groundwater, and nearby deformation. If a buried channel becomes flat or jumps suddenly, inspect cable continuity and recent site work before treating it as a real soil change. Buried points are easy to forget, so their maintenance history must be visible in the project file.
If the reading seems unusual, the team should check the physical condition of the station before drawing conclusions about the asset. Blockage, poor exposure, loose wiring, water entry, and changed surroundings can all create misleading patterns.
A practical report links the condition value with time, place, and action. It should help a reviewer decide whether to keep observing, inspect the field point, compare nearby instruments, or record the event as normal site behavior.
Kingmach Temperature Sensor
Rainfall records are a central part of Kingmach Temperature Sensor for slopes, embankments, dams, tunnel portals, and construction sites. Rain does not always cause immediate movement; water may enter the ground, raise pore pressure, soften material, or change runoff over time. That delay is exactly why a dated rainfall record matters. Engineers can compare the storm start, rainfall duration, peak intensity, soil response, and movement curve. Without that record, a slope alarm may be discussed as a vague weather event. With it, the team can see whether movement followed the storm, whether it continued after rain stopped, and whether field inspection is needed. Rain data becomes part of the engineering timeline rather than a background note.
The environmental point should be part of a named monitoring question. It may explain wetting, drying, wind exposure, thermal movement, cabinet stress, or pressure variation, but that purpose needs to be visible in drawings and reports.
If the reading seems unusual, the team should check the physical condition of the station before drawing conclusions about the asset. Blockage, poor exposure, loose wiring, water entry, and changed surroundings can all create misleading patterns.
FAQ
Q: How does rainfall data support slope review?
A: Rainfall gives the timing and intensity background for movement, seepage, wetting, and field inspections after storms.
Q: Why measure soil wetness as well as rainfall?
A: Rainfall stays at the surface record, while buried wetness shows whether water reached the soil depth that may influence movement.
Q: How does wind data support bridge or tower monitoring?
A: Wind direction and exposure can explain vibration, deflection, access difficulty, and weather-driven structural response.
Q: Why monitor humidity underground?
A: Humidity can affect cabinets, connectors, corrosion, sensor stability, and operating conditions in tunnels, subways, mines, and equipment spaces.
Q: How does temperature help interpretation?
A: Temperature helps reviewers separate thermal behavior from structural change in strain, displacement, cabinet condition, or material response.
Long-term value comes from consistency. A channel that keeps the same location, unit, maintenance history, and linked asset record can support seasonal comparison, post-storm review, and handover between construction and operation teams.
Reviews
Joshua Clark
We ordered a full monitoring solution including sensors and data loggers. Everything works seamlessly together. Great supplier!
Andrew Lee
The visualization software is intuitive and powerful. It helps us analyze monitoring data efficiently.
Latest Inquiries
To protect the privacy of our buyers, only public service email domains like Gmail, Yahoo, and MSN will be displayed. Additionally, only a limited portion of the inquiry content will be shown.
Sophia***@gmail.comUnited Kingdom
Good day, we need environmental monitoring sensors including temperature, humidity, and wind sensors...
Mia***@gmail.comNetherlands
Dear team, we are interested in your readouts & data loggers compatible with multiple sensors. Do yo...
Related product categories
- wind direction and speed sensor
- wind speed and direction sensors
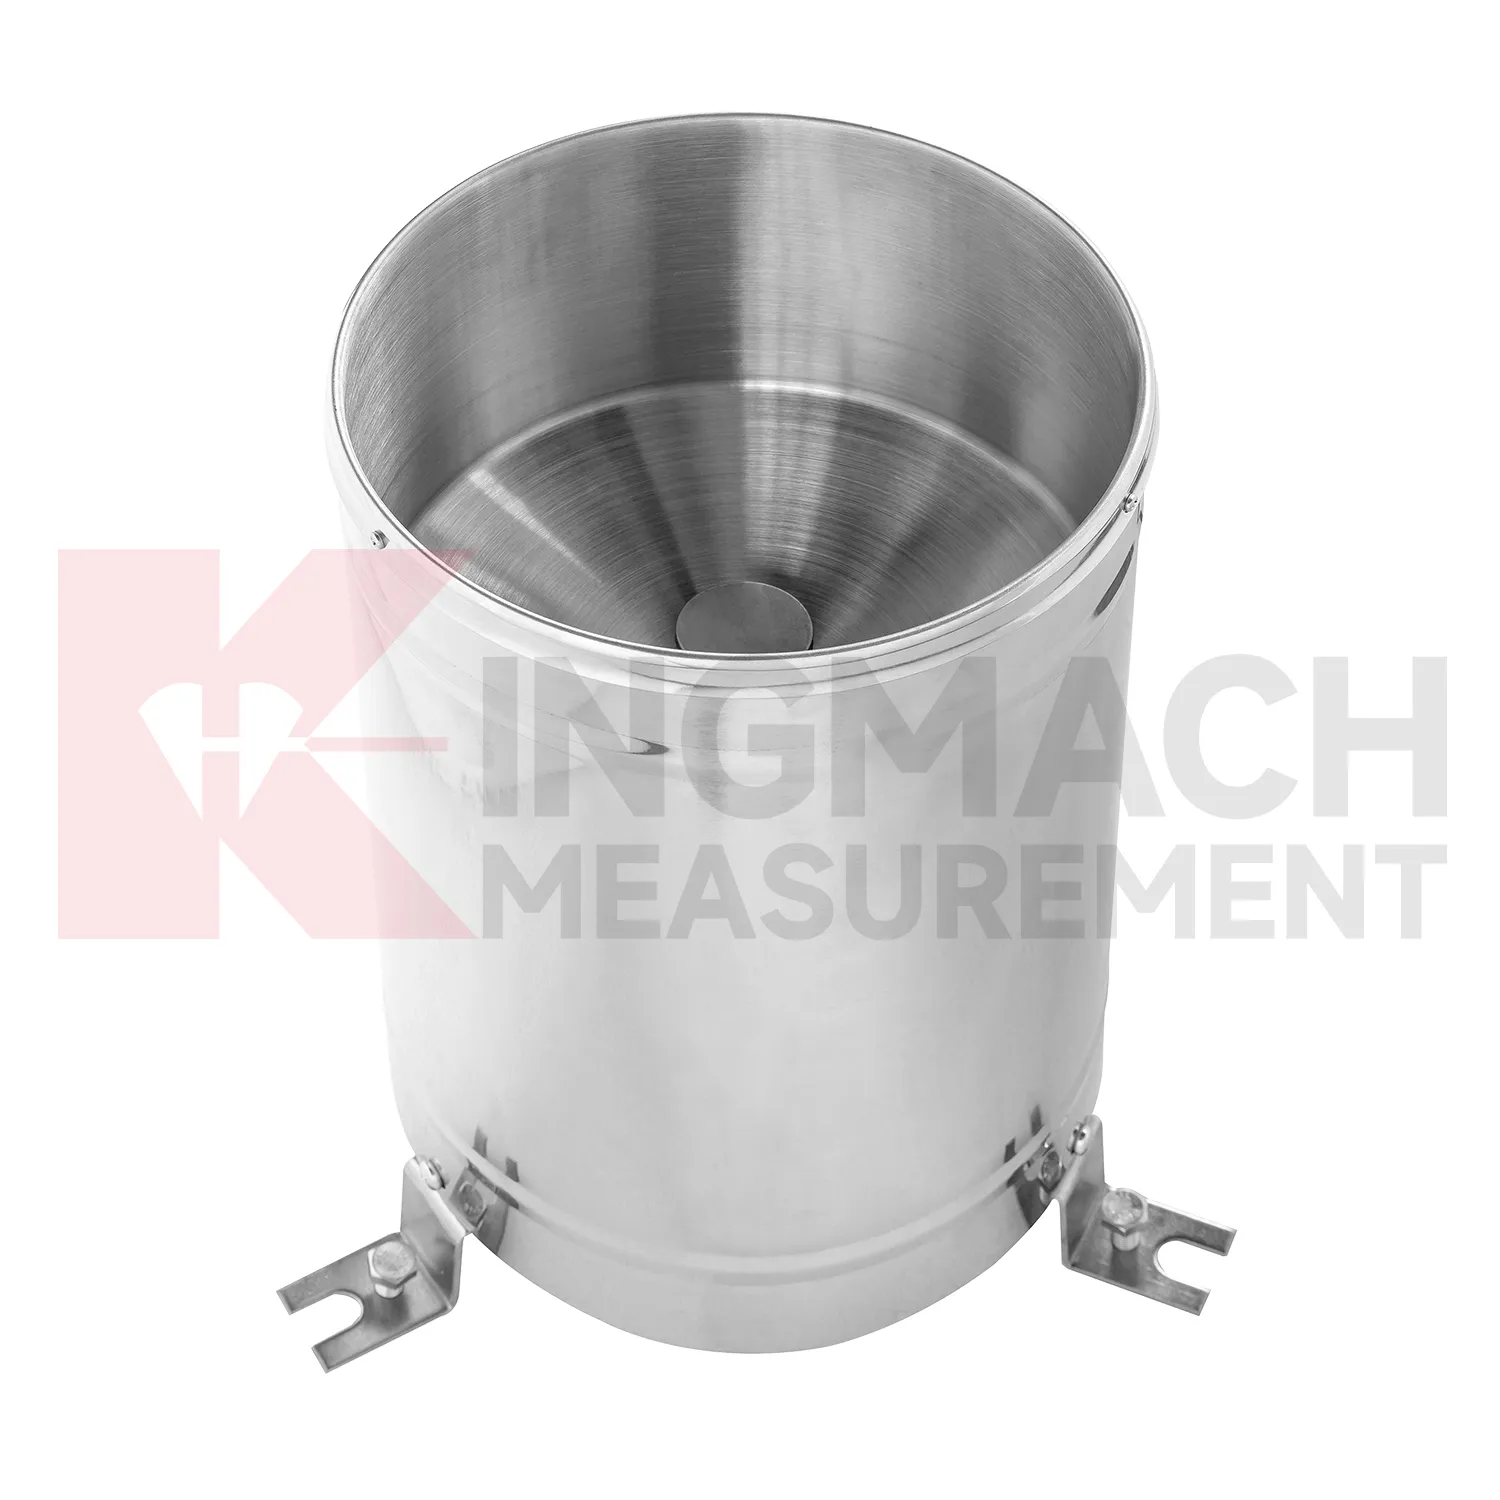
- tipping bucket rain gauge
- tipping bucket rain gauge resolution 0.2 mm standard
- tipping bucket rain gauges
- tipping bucket rain gauge resolution 0.1 mm 0.2 mm standard
- tipping bucket rain gauge resolution 0.1 mm standard
- rain gauge tipping bucket
- tipping bucket rain gauge sensor
- tipping bucket type rain gauge
- tipping rain bucket gauge
- tipping bucket rain gauge 0.2 mm per tip standard