 ar
ar bg
bg hr
hr cs
cs da
da nl
nl fi
fi fr
fr de
de el
el hi
hi it
it ko
ko no
no pl
pl pt
pt ro
ro ru
ru es
es sv
sv tl
tl iw
iw id
id lv
lv lt
lt sr
sr sk
sk sl
sl uk
uk vi
vi et
et hu
hu th
th tr
tr fa
fa ms
ms hy
hy ka
ka ur
ur bn
bn mn
mn ta
ta kk
kk uz
uz ku
ku
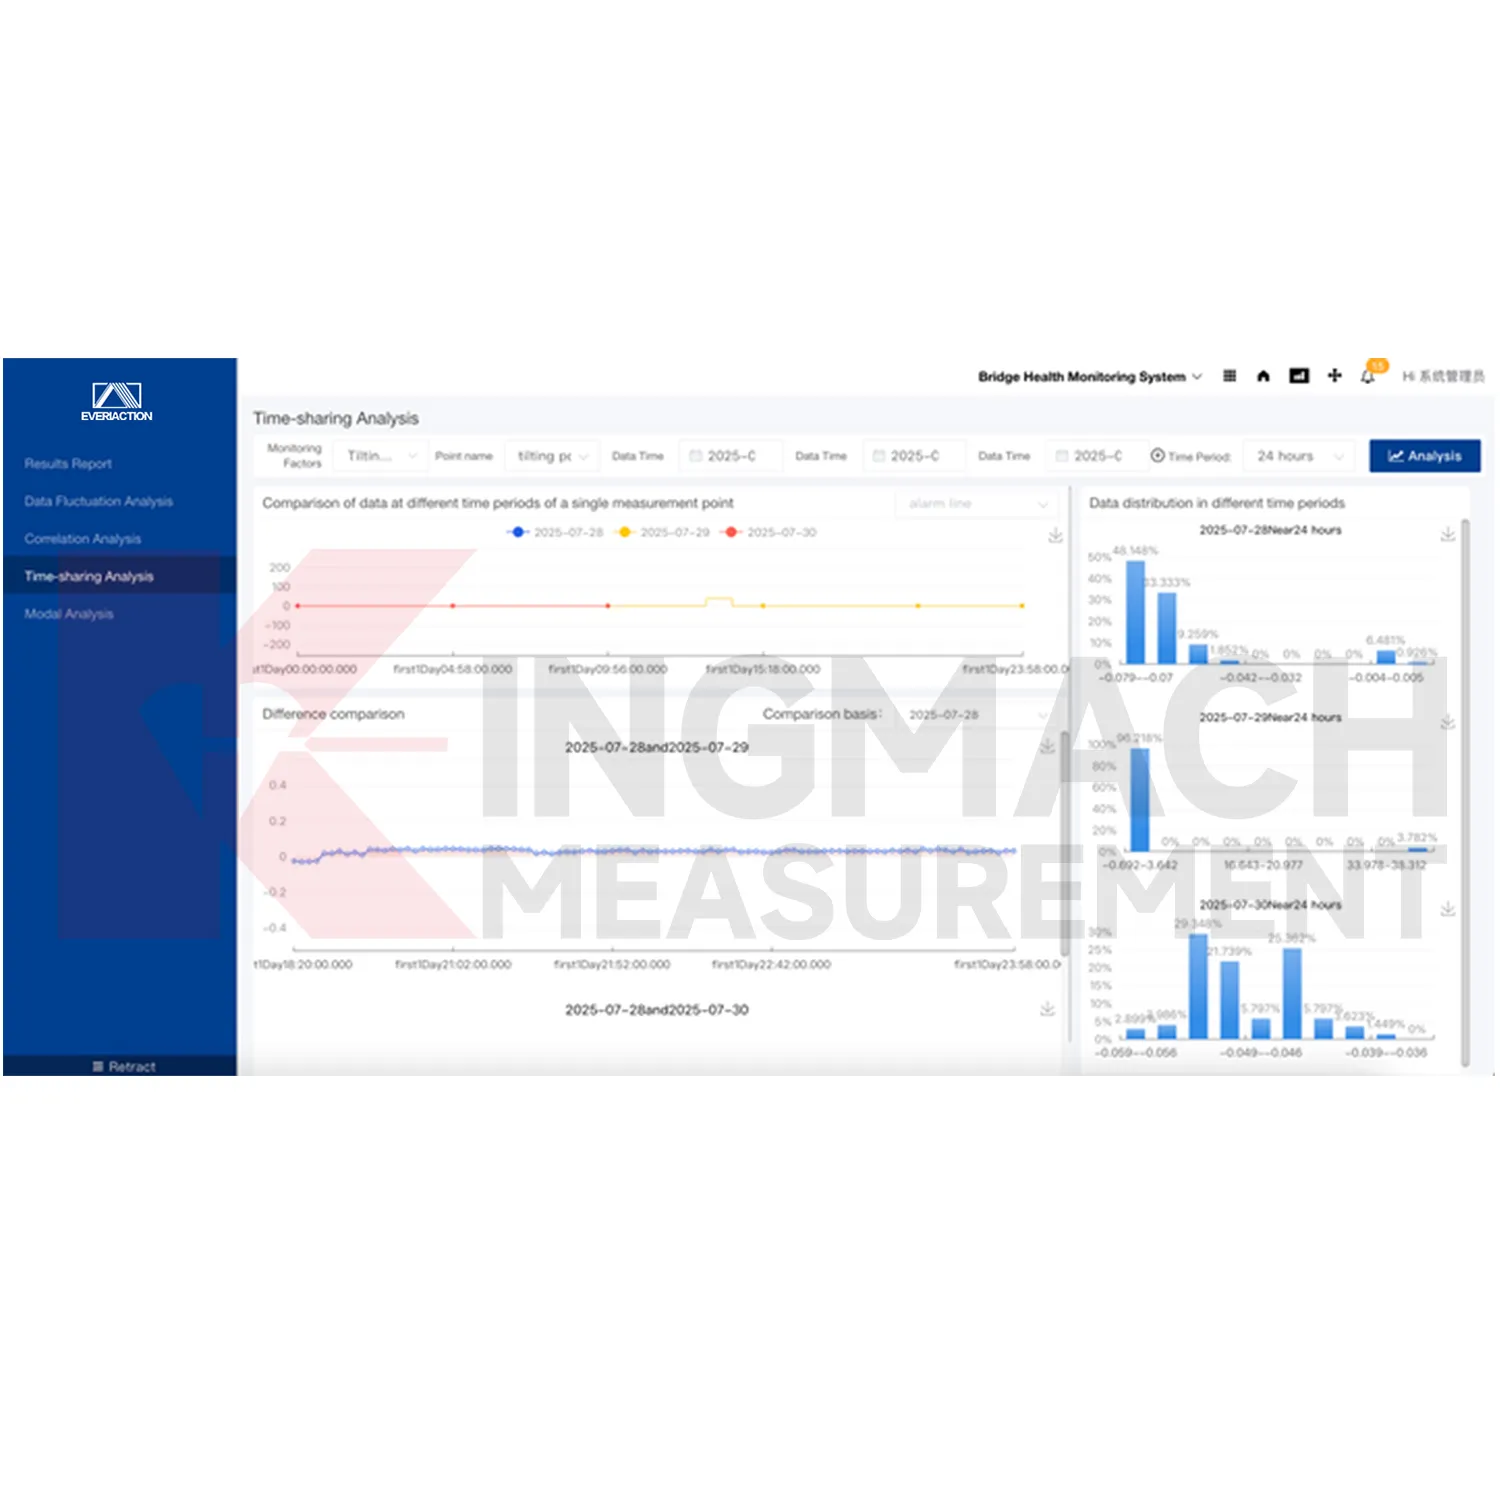
Visualization Software
Kingmach Visualization Software supports project-based management. Users can create new projects and operate a single project as a management unit. The platform can update and maintain basic project information, dynamic project information, inspection and maintenance records, alarm levels, and project documents. This structure is useful for owners who need long-term records across different assets, phases, and teams. It also makes handover easier because data, alarms, documents, and maintenance history are not stored in unrelated places.
Application of Visualization Software
Tunnel monitoring uses Kingmach Visualization Software to manage deformation, convergence, settlement, water level, vibration, temperature, and construction activity records. Tunnel data can change during excavation, lining work, nearby blasting, drainage changes, or operation. A project-based platform helps compare readings across sections and dates, then connect abnormal values with inspection and maintenance notes. Real-time filtering and alarm configuration help teams respond before a localized issue is hidden inside large volumes of routine data.
The future of Visualization Software
Cybersecurity and data governance will become more visible around Kingmach Visualization Software. The local product file notes multiple security protocols and transmission methods. As monitoring data moves through cloud systems and remote access points, users will need clearer rules for account access, data storage, document control, alarm review, and report release. Strong governance helps protect the integrity of structural safety records and keeps responsibility clear across owners, operators, and engineering teams.
Care & Maintenance of Visualization Software
Data quality checks should be routine in Kingmach Visualization Software. Look for missing values, frozen channels, impossible jumps, timestamp errors, unit mismatch, repeated noise, or disagreement between related sensors. A platform can display data quickly, but engineering trust depends on the quality of the incoming records. When a problem appears, check the field device, cable, communication path, acquisition module, and recent configuration changes before treating the reading as structural behavior.
Kingmach Visualization Software
Alarm management is one of the practical strengths of Kingmach Visualization Software. The platform supports flexible alarm rule configuration and can provide detailed fault information in real time when a structure fails or a monitoring value crosses the configured logic. A useful alarm is not just a red mark on a screen; it needs point identity, time, severity, related data, and maintenance reference. By combining alarm rules with project records and monitoring channels, the platform helps teams respond to abnormal behavior with more discipline and less guesswork.
FAQ
Q: How are trend curves used?
A: They help compare current readings with earlier behavior so gradual movement, sudden jumps, or event response can be reviewed.
Q: What does real-time filtering help with?
A: It reduces noisy or distracting records before users study the channel history.
Q: How do alarms guide action?
A: Configured rules point users toward the affected point, severity level, time, and related follow-up record.
Q: What makes reports easier?
A: Stored trends, alarms, project files, and expert review notes can be gathered without rebuilding the evidence manually.
Q: Why is graphical display useful?
A: Graphs help users see movement direction, timing, and abnormal patterns faster than raw tables alone.
Reviews
Michael Anderson
The strain gauges and load cells are extremely accurate and stable. They performed very well in our bridge monitoring project. Highly recommended!
Robert Taylor
The weir flow meter is well-built and delivers accurate measurements. Great value for water management applications.
Latest Inquiries
To protect the privacy of our buyers, only public service email domains like Gmail, Yahoo, and MSN will be displayed. Additionally, only a limited portion of the inquiry content will be shown.
Mia***@gmail.comNetherlands
Dear team, we are interested in your readouts & data loggers compatible with multiple sensors. Do yo...
Charlotte***@gmail.comUnited Arab Emirates
Hi, we require instrumentation cables suitable for harsh environments. Could you advise on specifica...
Related product categories
- Monitoring Software Suite
- Monitoring system software platform
- Environmental Monitoring
- Visualization Software
- GPS Displacement Monitoring System
- Integrated Monitoring Station
- Settlement Monitoring Rod
- Structural Health Monitoring (SHM) System
- Structural Monitoring Cloud Platform
- IoT Online Monitoring System
- Monitoring System Platform & Services
- Engineering Pulse Intelligent Monitoring Cloud Platform